Tutorials
Introduction
This chapter provides a “how-to” on nomogram construction using the PyNomo library. It assumes you’ve already installed and tested PyNomo in your environment and can successfully build the nomograms in the block type descriptions.
Program listings for all the tutorials are at the end of this chapter.
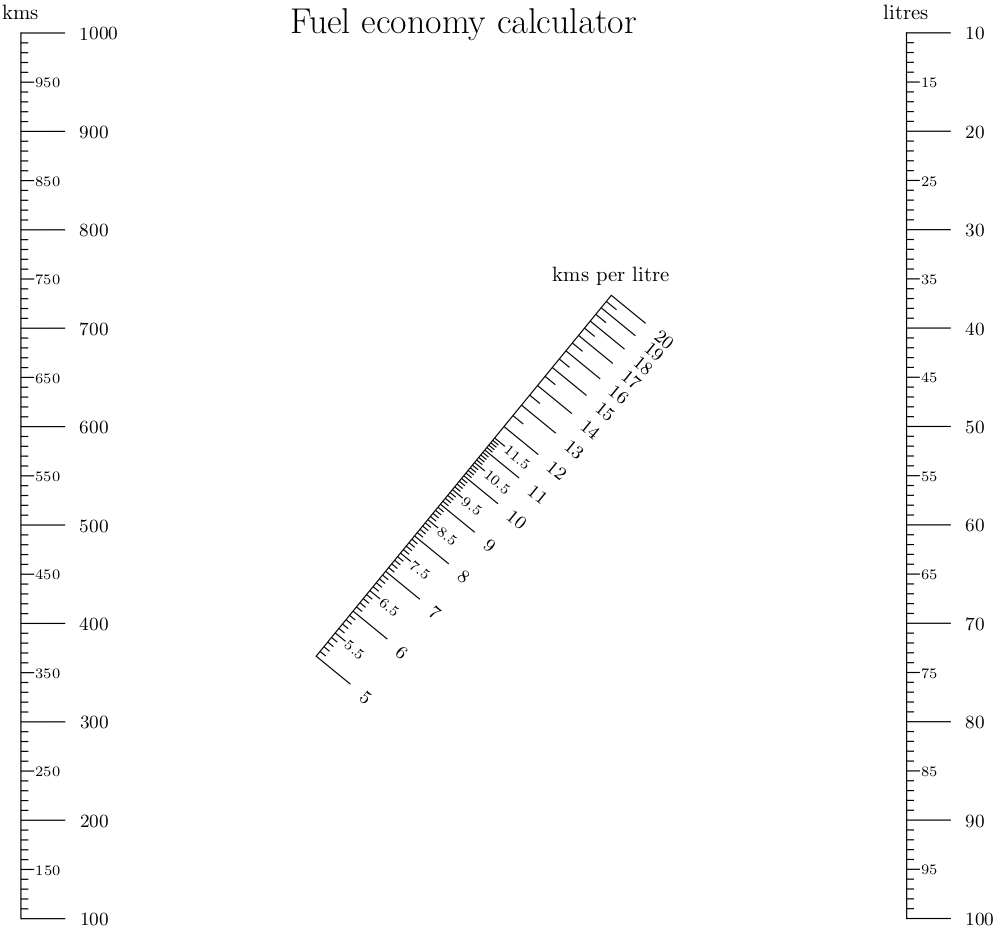
Tutorial 1: Vehicle economy calculator
Objective
Construct an “N” type nomogram to calculate a vehicle’s range, fuel consumption or fuel economy given any two of these values. The nomogram will be built using linear scales.
Nomogram construction
Nomogram construction involves several steps. The first is always to identify the variables and their relationship. In this tutorial we need to consider three variables:
distance (\(d\)) measured in kilometres,
fuel consumed (\(c\)) measured in litres, and
fuel economy (\(e\)) measured in kilometres driven per litre consumed.
The relationship between these variables is:
\(d = {e\times c}.\)
This equation satisfies the form for a Type 2 nomogram (see section 6.2) as follows:
\(F_1(u_1) = {F_2(u_2)F_3(u_3)},\)
where
\(F_1(u_1) = u_1 = d\),
\(F_2(u_2) = u_2 = e\)
and
\(F_3(u_3) = u_3 = c\).
All scales are linear and we choose a reasonable range of values (u_min and u_max) for each axis.
11dist_SI = {
12    # distance in kilometers (u1)
13    'u_min': 100.0,
14    'u_max': 1000.0,
15    'function': lambda u: u,
16    'title': r'kms',
17    'tick_levels': 3,
18    'tick_text_levels': 2,
19}
20
21eff_SI = {
22    # fuel efficiency in km / litre) (u2)
23    'u_min': 5.0,
24    'u_max': 20.0,
25    'function': lambda u: u,
26    'title': r'kms per litre',
27    'tick_levels': 3,
28    'tick_text_levels': 2,
29    'scale_type': 'linear smart',
30}
31
32fuel_SI = {
33    # fuel consumption in litres (u3)
34    'u_min': 10.0,
35    'u_max': 100.0,
36    'function': lambda u: u,
37    'title': r'litres',
38    'tick_levels': 3,
39    'tick_text_levels': 2,
40}
These scales are linked into a single block as follows:
42block_SI = {
43    'block_type': 'type_2',
44    'f1_params': dist_SI,
45    'f2_params': eff_SI,
46    'f3_params': fuel_SI,
47}
Note
Parameters f1_params, f2_params and f3_params represent parameters
including functions for variables \(u_1\), \(u_2\) and \(u_3\) respectively.
Finally, we define main parameters of the nomogram and generate the chart:
49main_params = {
50    'filename': 'tutorial1a.eps',
51    'paper_height':15.0,
52    'paper_width':15.0,
53    'block_params': [block_SI],
54    'transformations': [('rotate', 0.01), ('scale paper',)],
55    'title_str': r'\LARGE Fuel economy calculator',
56}
57Nomographer(main_params)
Generated nomogram
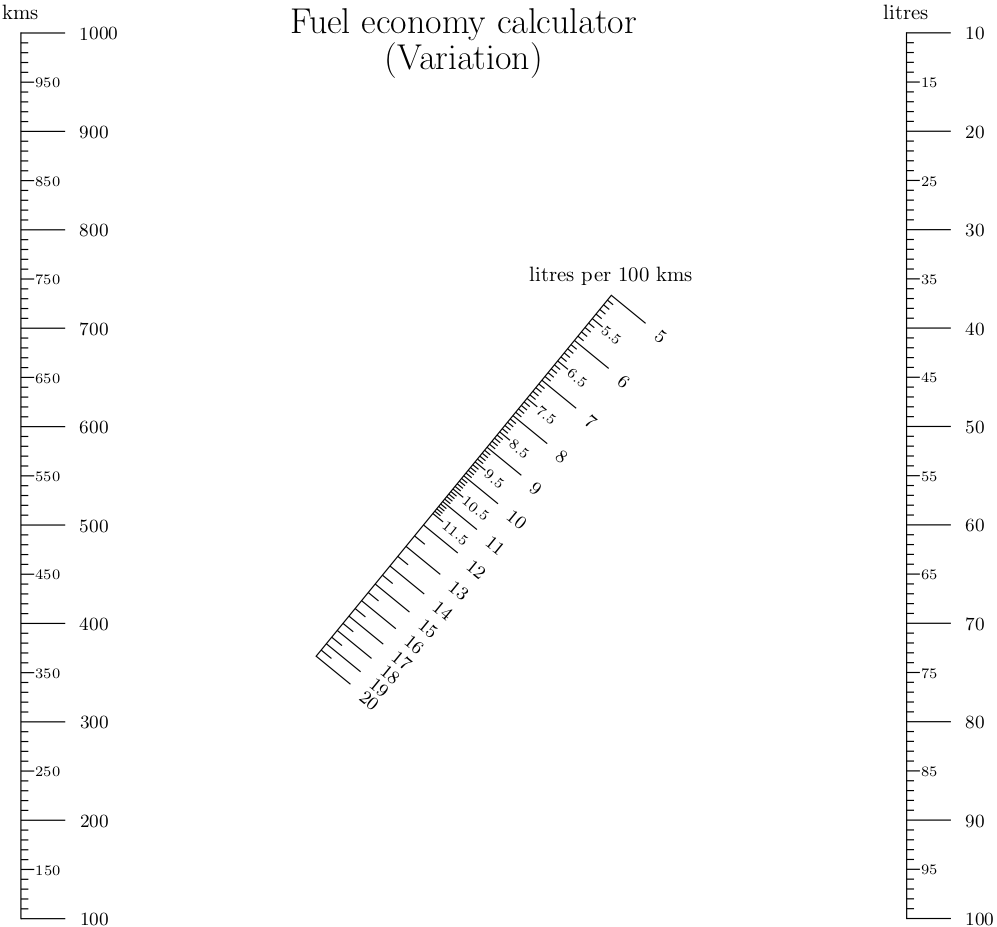
A variation on vehicle economy calculator
The previously generated nomogram is complete but doesn’t express the vehicle’s economy the way we would like. A vehicle’s fuel economy is more often expressed in litres consumed per 100 kilometres driven, 100 times the reciprocal of the original function. How do we do this?
Recall that
\(d = {e\times c}\)
and thus
\({\frac{d}{c}} = e\).
We express the reciprocal of the economy by rearranging the formula as
\(\frac{c}{d} = \frac{1}{e}\).
Since our goal is to describe fuel economy in terms of litres per 100 km we multiply \(\frac{1}{e}\) by 100 to achieve the correct units:
\(\frac{c}{d} = \frac{100.0}{e}\).
\(u_2 = e\) so our function for \(u_2\) becomes
\(\frac{100.0}{u_2}\)
and we amend the axis definition:
21eff_SI = {
22    # fuel efficiency in litres / 100 kilometres) (u2)
23    'u_min': 5.0,
24    'u_max': 20.0,
25    'function': lambda u: 100.0/u,
26    'title': r'litres per 100 kms',
27    'tick_levels': 3,
28    'tick_text_levels': 2,
29    'scale_type': 'linear smart',
30}
Generated nomogram
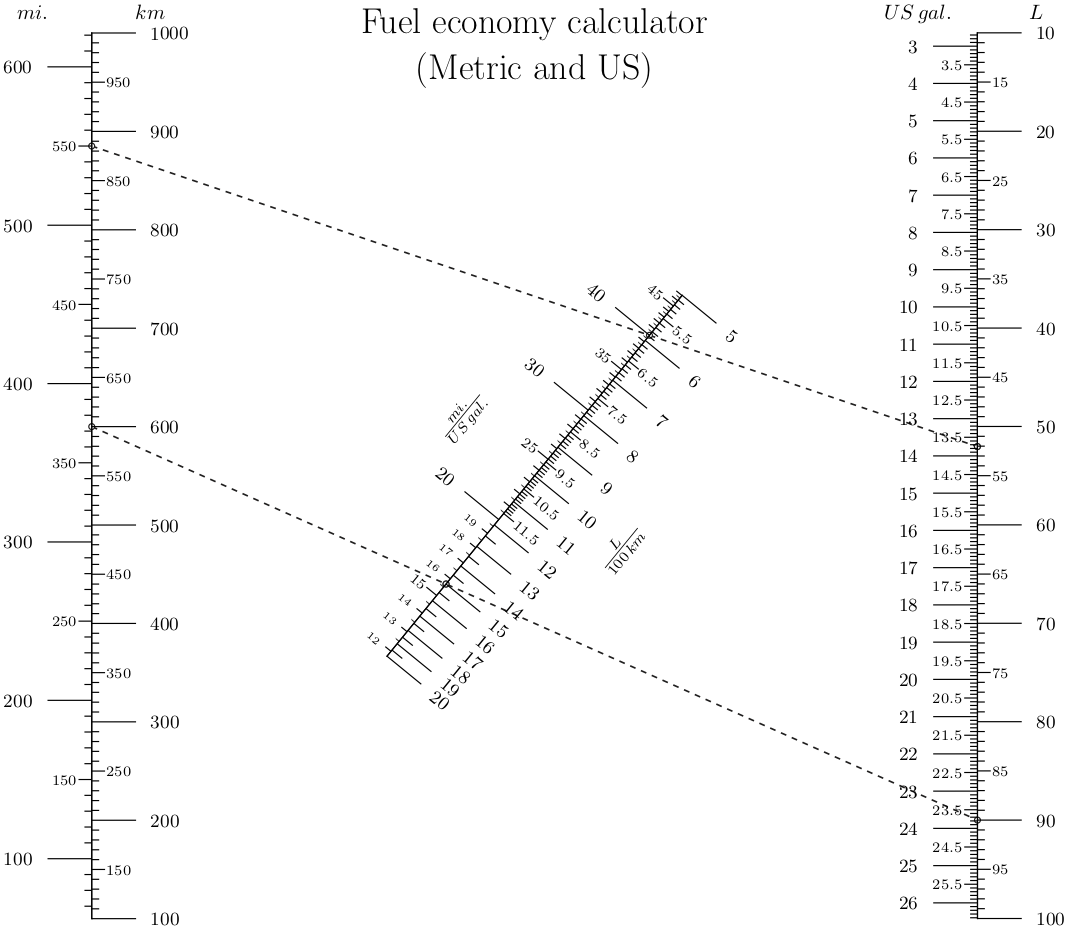
Tutorial 2: Vehicle economy calculator (Metric and US)
Objective
Create a new nomogram similar to the one shown in Tutorial 1 but add scales for American units of measure (miles and US gallons). This tutorial will cover:
Aligning and adjusting compatible scales.
Modifying axis parameters (titles and tick location) to improve readability.
Creating isopleths.
Combining blocks into a single nomogram.
Nomogram construction
Recapping from the first part of Tutorial 1, we know that
\(d = {e\times c}\),
where \(e\) (economy) was expressed in terms of distance travelled per unit volume of fuel. This is precisely what we want but we need to adjust the scales for American units of measure. This is accomplished by:
Converting the minimum (
u_min) and maximum (u_max) values in the axis to match those in the SI unit axis.Aligning the distance and fuel consumed axis so that they match the height of the SI unit axis.
Tagging the distance and fuel scales so that they align horizontally with their metric system counterparts.
Thus our three new scales are defined as follows:
25dist_US = {
26    # distance in miles (u1)
27    'tag': 'distance',
28    'u_min': 100.0/1.609344,    # convert kilometers to miles
29    'u_max': 1000.0/1.609344,
30    'function': lambda u: u,    # plot the u values linearly ...
31    'align_func': lambda u: u*1.609344,   # but adjust the length to match kilometers
32    'title': r'$mi.$',
33    'tick_levels': 3,
34    'tick_text_levels': 2,
35    'tick_side': 'left',
36    'title_x_shift': -1.0,
37}
52eff_US = {
53    # fuel efficiency in miles per US gallon) u2
54    'u_min': 235.189/20.0,      # magic value to coordinate length of SI and US scale
55    'u_max': 235.189/5.0,
56    'function': lambda u: u,
57    'title': r'$\frac{mi.}{US \, gal.}$',
58    'tick_levels': 4,
59    'tick_text_levels': 3,
60    'scale_type': 'linear smart',
61    'tick_side': 'left',
62    'title_draw_center': True,
63    'title_distance_center': -1.5,
64}
78fuel_US = {
79    # fuel consumption in US gallons
80    'tag': 'consumption',
81    'u_min': 10.0/3.785,    # convert liters to USG
82    'u_max': 100.0/3.785,
83    'function': lambda u: u,    # plot the gallons
84    'align_func': lambda u: u*3.785,   # but must be scaled up to litres
85    'title': r'$US \, gal.$',
86    'tick_levels': 3,
87    'tick_text_levels': 2,
88    'tick_side': 'left',
89    'title_x_shift': -1.0,
90}
Tags are also added to the SI units axis:
13dist_SI = {
14    # distance in kilometers (u1)
15    'tag': 'distance',
16    'u_min': 100.0,
66fuel_SI = {
67    # fuel consumption in litres (u3)
68    'tag': 'consumption',
69    'u_min': 10.0,
Notice no alignment function or tag is specified for the eff_US axis. None are required because this axis is a function of the dist_US and fuel_US axis which are already scaled appropriately therefore its alignment is automatic.
A new block is created to link the three new scales with an isopleth (solution line):
100block_US = {
101    'block_type': 'type_2',
102    'f1_params': dist_US,
103    'f2_params': eff_US,
104    'f3_params': fuel_US,
105    'isopleth_values': [[550, 40.0, 'x']],
106}
Since all blocks must contain the same number of isopleths, we add one to the block_SI axis:
92block_SI = {
93    'block_type': 'type_2',
94    'f1_params': dist_SI,
95    'f2_params': eff_SI,
96    'f3_params': fuel_SI,
97    'isopleth_values': [[600, 'x', 90]],
98}
Finally, block_US is added to the block_params key:
108main_params = {
109    'filename': 'tutorial2.pdf',
110    'paper_height':15.0,
111    'paper_width':15.0,
112    'block_params': [block_SI, block_US],
113    'transformations': [('rotate', 0.01), ('scale paper',)],
114    'title_str': r'\LARGE Fuel economy calculator (Metric and US)',
115}
This nomogram holds useful features. The individual scales for distance, fuel consumption and fuel economy can be used on their own to convert from one system of measurement to another. Another feature is the ability to use variables from different system of units (e.g. kilometres and US gallons) and calculate fuel economy in either miles per gallon or litres per 100 km.
Generated nomogram
Tutorial Program Listings
Tutorial 1 program listing
 1"""
 2    tutorial1a.py
 3
 4    Simple nomogram of relationship between auto fuel consumption and distance travelled
 5
 6"""
 7import sys
 8sys.path.insert(0, "..")
 9from pynomo.nomographer import *
10
11dist_SI = {
12    # distance in kilometers (u1)
13    'u_min': 100.0,
14    'u_max': 1000.0,
15    'function': lambda u: u,
16    'title': r'kms',
17    'tick_levels': 3,
18    'tick_text_levels': 2,
19}
20
21eff_SI = {
22    # fuel efficiency in km / litre) (u2)
23    'u_min': 5.0,
24    'u_max': 20.0,
25    'function': lambda u: u,
26    'title': r'kms per litre',
27    'tick_levels': 3,
28    'tick_text_levels': 2,
29    'scale_type': 'linear smart',
30}
31
32fuel_SI = {
33    # fuel consumption in litres (u3)
34    'u_min': 10.0,
35    'u_max': 100.0,
36    'function': lambda u: u,
37    'title': r'litres',
38    'tick_levels': 3,
39    'tick_text_levels': 2,
40}
41
42block_SI = {
43    'block_type': 'type_2',
44    'f1_params': dist_SI,
45    'f2_params': eff_SI,
46    'f3_params': fuel_SI,
47}
48
49main_params = {
50    'filename': 'tutorial1a.eps',
51    'paper_height':15.0,
52    'paper_width':15.0,
53    'block_params': [block_SI],
54    'transformations': [('rotate', 0.01), ('scale paper',)],
55    'title_str': r'\LARGE Fuel economy calculator',
56}
57Nomographer(main_params)
Tutorial 1 program listing (variation)
 1"""
 2    tutorial1b.py
 3
 4    Simple nomogram of relationship between auto fuel consumption and distance travelled
 5
 6"""
 7import sys
 8sys.path.insert(0, "..")
 9from pynomo.nomographer import *
10
11dist_SI = {
12    # distance in kilometers (u1)
13    'u_min': 100.0,
14    'u_max': 1000.0,
15    'function': lambda u: u,
16    'title': r'kms',
17    'tick_levels': 3,
18    'tick_text_levels': 2,
19}
20
21eff_SI = {
22    # fuel efficiency in litres / 100 kilometres) (u2)
23    'u_min': 5.0,
24    'u_max': 20.0,
25    'function': lambda u: 100.0/u,
26    'title': r'litres per 100 kms',
27    'tick_levels': 3,
28    'tick_text_levels': 2,
29    'scale_type': 'linear smart',
30}
31
32fuel_SI = {
33    # fuel consumption in litres (u3)
34    'u_min': 10.0,
35    'u_max': 100.0,
36    'function': lambda u: u,
37    'title': r'litres',
38    'tick_levels': 3,
39    'tick_text_levels': 2,
40}
41
42block_SI = {
43    'block_type': 'type_2',
44    'f1_params': dist_SI,
45    'f2_params': eff_SI,
46    'f3_params': fuel_SI,
47}
48
49main_params = {
50    'filename': 'tutorial1b.eps',
51    'paper_height':15.0,
52    'paper_width':15.0,
53    'block_params': [block_SI],
54    'transformations': [('rotate', 0.01), ('scale paper',)],
55    'title_str': r'\LARGE Fuel economy calculator (Variation)',
56    # 'make_grid': True,
57}
58Nomographer(main_params)
Tutorial 2 program listing
  1"""
  2    tutorial2.py
  3
  4    Compound nomogram of relationship between auto fuel consumption and distance traveled in metric and US units.
  5
  6"""
  7import sys
  8sys.path.insert(0, "..")
  9from pynomo.nomographer import *
 10
 11text.set(mode="latex")  # allows use of latex commands in PyX such as \frac{a}{b} and \par
 12
 13dist_SI = {
 14    # distance in kilometers (u1)
 15    'tag': 'distance',
 16    'u_min': 100.0,
 17    'u_max': 1000.0,
 18    'function': lambda u: u,
 19    'title': r'$km$',
 20    'tick_levels': 3,
 21    'tick_text_levels': 2,
 22    'title_x_shift': 1.0,
 23}
 24
 25dist_US = {
 26    # distance in miles (u1)
 27    'tag': 'distance',
 28    'u_min': 100.0/1.609344,    # convert kilometers to miles
 29    'u_max': 1000.0/1.609344,
 30    'function': lambda u: u,    # plot the u values linearly ...
 31    'align_func': lambda u: u*1.609344,   # but adjust the length to match kilometers
 32    'title': r'$mi.$',
 33    'tick_levels': 3,
 34    'tick_text_levels': 2,
 35    'tick_side': 'left',
 36    'title_x_shift': -1.0,
 37}
 38
 39eff_SI = {
 40    # fuel efficiency in km / litre) (u2)
 41    'u_min': 5.0,
 42    'u_max': 20.0,
 43    'function': lambda u: 100.0/u,
 44    'title': r'$\frac{L}{100 \, km}$',
 45    'tick_levels': 3,
 46    'tick_text_levels': 2,
 47    'scale_type': 'linear smart',
 48    'title_draw_center': True,
 49    'title_distance_center': -2.0,
 50}
 51
 52eff_US = {
 53    # fuel efficiency in miles per US gallon) u2
 54    'u_min': 235.189/20.0,      # magic value to coordinate length of SI and US scale
 55    'u_max': 235.189/5.0,
 56    'function': lambda u: u,
 57    'title': r'$\frac{mi.}{US \, gal.}$',
 58    'tick_levels': 4,
 59    'tick_text_levels': 3,
 60    'scale_type': 'linear smart',
 61    'tick_side': 'left',
 62    'title_draw_center': True,
 63    'title_distance_center': -1.5,
 64}
 65
 66fuel_SI = {
 67    # fuel consumption in litres (u3)
 68    'tag': 'consumption',
 69    'u_min': 10.0,
 70    'u_max': 100.0,
 71    'function': lambda u: u,
 72    'title': r'$L$',
 73    'tick_levels': 3,
 74    'tick_text_levels': 2,
 75    'title_x_shift': 1.0,
 76}
 77
 78fuel_US = {
 79    # fuel consumption in US gallons
 80    'tag': 'consumption',
 81    'u_min': 10.0/3.785,    # convert liters to USG
 82    'u_max': 100.0/3.785,
 83    'function': lambda u: u,    # plot the gallons
 84    'align_func': lambda u: u*3.785,   # but must be scaled up to litres
 85    'title': r'$US \, gal.$',
 86    'tick_levels': 3,
 87    'tick_text_levels': 2,
 88    'tick_side': 'left',
 89    'title_x_shift': -1.0,
 90}
 91
 92block_SI = {
 93    'block_type': 'type_2',
 94    'f1_params': dist_SI,
 95    'f2_params': eff_SI,
 96    'f3_params': fuel_SI,
 97    'isopleth_values': [[600, 'x', 90]],
 98}
 99
100block_US = {
101    'block_type': 'type_2',
102    'f1_params': dist_US,
103    'f2_params': eff_US,
104    'f3_params': fuel_US,
105    'isopleth_values': [[550, 40.0, 'x']],
106}
107
108main_params = {
109    'filename': 'tutorial2.pdf',
110    'paper_height':15.0,
111    'paper_width':15.0,
112    'block_params': [block_SI, block_US],
113    'transformations': [('rotate', 0.01), ('scale paper',)],
114    'title_str': r'\LARGE Fuel economy calculator (Metric and US)',
115}
116Nomographer(main_params)