Axes
Axes by example
Axes are fundamental building blocks of nomographs. The following code uses minimal axis definion N_params that is
rendered as a linear scale illustrated below. The range of values axis represents is defined with keywords u_min
and u_max. title sets title string for the axis. Key part of the nomograph is the functional form of the axis.
In the example below it is defined with keyword function and is given as a function. Different types of blocks assume different keywords
of axis functions. For example types 1, 2 and 3 take keyword function but type 9 takes either f, g, h or
f_grid, g_grid, h_grid keywords. So one have to define axis parameters compatible with the used block type.
In the examples below Type 8 is used as block to taking axis definition because it is the simplest one.
Linear scale ('scale_type':'linear')
Here we start with the simplest axis. It has by default scale 'scale_type':'linear' that is simple linear scale.
 1# ex_axes_1.py
 2
 3import sys
 4
 5sys.path.insert(0, "..")
 6from pynomo.nomographer import Nomographer
 7
 8# axis definitions
 9N_params = {'u_min': 1.0,  # axis start value
10            'u_max': 10.0,  # axis stop value
11            'function': lambda u: u,  # axis function
12            'title': 'u',  # axis titles
13            }
14
15# block definitons defining one block of type 8
16block_params = {'block_type': 'type_8',
17                'f_params': N_params,
18                'width': 5.0,
19                'height': 15.0,
20                }
21
22# nomograph generation definitions
23main_params = {'filename': 'ex_axes_1.pdf',
24               'paper_height': 15.0,
25               'paper_width': 5.0,
26               'block_params': [block_params],
27               'transformations': [('scale paper',)]
28               }
29
30# actual code that builds the nomograph
31Nomographer(main_params)

Because the example above looked little too busy or packed, we reduce the ticks by using only three different tick levels
'tick_levels':3 and two tick text levels 'tick_text_levels':2. Tick side relative to the final drawing is set to
left using 'tick_side':'left'.
 1# ex_axes_2.py
 2
 3N_params = {'u_min': 1.0,
 4            'u_max': 10.0,
 5            'function': lambda u: u,
 6            'title': 'u',
 7            'tick_levels': 3,        # <-
 8            'tick_text_levels': 2,   # <-
 9            'tick_side': 'left',     # <-
10            }
11
12block_params = {'block_type': 'type_8',
13                'f_params': N_params,
14                'width': 5.0,
15                'height': 10.0,
16                }
17
18main_params = {'filename': 'ex_axes_2.pdf',
19                'paper_height': 10.0,
20                'paper_width': 5.0,
21                'block_params': [block_params],
22                'transformations': [('scale paper',)]
23               }
24
25Nomographer(main_params)

Title position can be shifted in both x- and y-directions. In the following we shift it using key-values
'title_x_shift':-1.0 and 'title_y_shift':0.5. Units are here centimeters.
 1# ex_axes_3.py
 2
 3N_params = {'u_min': 1.0,
 4            'u_max': 10.0,
 5            'function': lambda u: u,
 6            'title': 'u',
 7            'tick_levels': 3,
 8            'tick_text_levels': 2,
 9            'tick_side': 'left',
10            'title_x_shift': -1.0,   # <-
11            'title_y_shift': 0.5     # <-
12            }
13
14block_params = {'block_type': 'type_8',
15                'f_params': N_params,
16                'width': 5.0,
17                'height': 10.0,
18                }
19
20main_params = {'filename': 'ex_axes_3.pdf',
21               'paper_height': 10.0,
22               'paper_width': 5.0,
23               'block_params': [block_params],
24               'transformations': [('scale paper',)]
25               }
26
27Nomographer(main_params)

Sometimes single level of axis definitions is not enough. We might want to add more ticks in some additional range of the axis.
Keyword 'extra_params' helps here. Value for this key is an array of dictionaries that modify given params in the
given range set by u_min and u_max. In the following example we define additional ranges with more ticks in ranges
5.0..10.0 and 9.0..10.0. We also draw title this time to center using 'title_draw_center:True.
 1# ex_axes_4.py
 2
 3N_params = {'u_min': 1.0,
 4            'u_max': 10.0,
 5            'function': lambda u: u,
 6            'title': 'title',
 7            'tick_levels': 2,
 8            'tick_text_levels': 1,
 9            'tick_side': 'left',
10            'title_draw_center': True,                 # <-
11            'extra_params': [{'u_min': 5.0,            # <- range 1
12                              'u_max': 10.0,           # <-
13                              'tick_levels': 3,        # <-
14                              'tick_text_levels': 2,   # <-
15                              },                       # <-
16                             {'u_min': 9.0,            # <- range 2
17                              'u_max': 10.0,           # <-
18                              'tick_levels': 4,        # <-
19                              'tick_text_levels': 2,   # <-
20                              }                        # <-
21                             ]                         # <-
22            }
23block_params = {'block_type': 'type_8',
24                'f_params': N_params,
25                'width': 5.0,
26                'height': 10.0,
27                }
28main_params = {'filename': 'ex_axes_4.pdf',
29               'paper_height': 10.0,
30               'paper_width': 5.0,
31               'block_params': [block_params],
32               'transformations': [('scale paper',)]
33               }
34Nomographer(main_params)

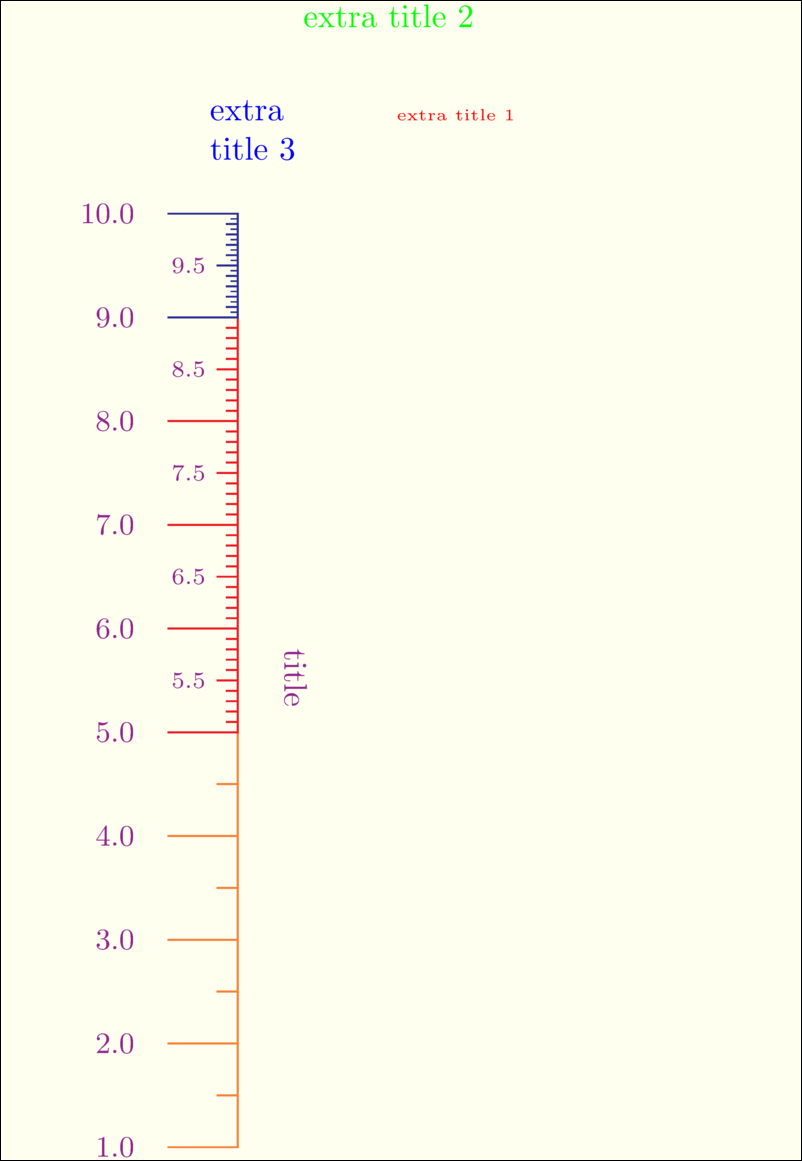
Color can be used to tune visual appearance of the axis. In the following example we tune colors with self-explaining
keywords 'axis_color', 'text_color' and 'title_color'. Additional titles are set by using keyword 'extra_titles'
with value of an array of dictionaries that can take keywords 'dx' and 'dy' as relative position to main title.
Value of keyword 'text'``sets the title text and ``'pyx_extra_defs' can be used to give additional parameters for pyx rendering
that is only option in current release. In the example numbers are formatted to have one three digits before comma and
and one digit after comma using 'text_format':r"$%3.1f$ ".
 1# ex_axes_4_1.py
 2
 3N_params = {'u_min': 1.0,
 4            'u_max': 10.0,
 5            'function': lambda u: u,
 6            'title': 'title',
 7            'tick_levels': 2,
 8            'tick_text_levels': 1,
 9            'tick_side': 'left',
10            'title_draw_center': True,
11            'text_format': r"$%3.1f$ ",                              # <- format numbers as %3.1f
12            'axis_color': color.cmyk.Orange,
13            'text_color': color.cmyk.Plum,
14            'title_color': color.cmyk.Plum,
15            'extra_params': [{'u_min': 5.0,
16                              'u_max': 10.0,
17                              'tick_levels': 3,
18                              'tick_text_levels': 2,
19                              'axis_color': color.cmyk.Red,
20                              },
21                             {'u_min': 9.0,
22                              'u_max': 10.0,
23                              'tick_levels': 4,
24                              'tick_text_levels': 2,
25                              'axis_color': color.cmyk.Blue,
26                              }
27                            ],
28            'extra_titles': [{'dx': 1.0,                                          # <- 1st extra title
29                              'dy': 1.0,                                          # <-
30                              'text': 'extra title 1',                            # <-
31                              'width': 5,                                         # <-
32                              'pyx_extra_defs': [color.rgb.red, text.size.tiny]   # <-
33                              },
34                            {'dx': 0.0,                                           # <- 2nd extra title
35                             'dy': 2.0,                                           # <-
36                             'text': 'extra title 2',                             # <-
37                             'width': 5,                                          # <-
38                             'pyx_extra_defs': [color.rgb.green]                  # <-
39                             },
40                            {'dx': -1.0,                                          # <- 3rd extra title
41                             'dy': 1.0,                                           # <-
42                             'text': r"extra  \par title 3",                      # <- \par = newline
43                             'width': 5,                                          # <-
44                             'pyx_extra_defs': [color.rgb.blue]                   # <-
45                             }]
46            }
47block_params = {'block_type': 'type_8',
48                'f_params': N_params,
49                'width': 5.0,
50                'height': 10.0,
51                }
52main_params = {'filename': 'ex_axes_4_1.pdf',
53               'paper_height': 10.0,
54               'paper_width': 5.0,
55               'block_params': [block_params],
56               'transformations': [('scale paper',)]
57               }
58Nomographer(main_params)
Manual point scale ('scale_type':'manual point')
Sometimes axes have to be defined manually. One option is to use manual point scale type with 'scale_type':'manual point'
and define the points as a dict to keyword 'manual_axis_data'.
 1# ex_axes_5.py
 2
 3N_params = {'u_min': 1.0,
 4            'u_max': 10.0,
 5            'function': lambda u: u,
 6            'title': 'title',
 7            'tick_levels': 2,
 8            'tick_text_levels': 1,
 9            'tick_side': 'left',
10            'title_draw_center': True,
11            'scale_type': 'manual point',        # <- use manual points
12            'manual_axis_data': {1.0: 'one',     # <- give point values as keys
13                                 2.0: 'two',     # <- and texts as values
14                                 3.0: 'three',
15                                 3.1415: r'$\pi$',
16                                 4.0: 'four',
17                                 5.0: 'five',
18                                 6.0: 'six',
19                                 7.0: 'seven',
20                                 8.0: 'eight',
21                                 9.0: 'nine',
22                                 10.0: 'ten'}
23            }
24block_params = {'block_type': 'type_8',
25                'f_params': N_params,
26                'width': 5.0,
27                'height': 10.0
28                }
29main_params = {'filename': 'ex_axes_5.pdf',
30               'paper_height': 10.0,
31               'paper_width': 5.0,
32               'block_params': [block_params],
33               'transformations': [('scale paper',)]
34               }
35Nomographer(main_params)

Manual line scale ('scale_type':'manual line')
Similarly other option is to use manual line scale type with 'scale_type':'manual line' that draws main scale line
and ticks. Drawn ticks are defined as a dict to keyword 'manual_axis_data' as above example.
 1# ex_axes_6.py
 2
 3N_params = {'u_min': 1.0,
 4            'u_max': 10.0,
 5            'function': lambda u: u,
 6            'title': 'title',
 7            'tick_levels': 2,
 8            'tick_text_levels': 1,
 9            'tick_side': 'left',
10            'title_draw_center': True,
11            'scale_type': 'manual line',     # <-
12            'manual_axis_data': {1.0: 'one',
13                                 2.0: 'two',
14                                 3.0: 'three',
15                                 3.1415: r'$\pi$',
16                                 4.0: 'four',
17                                 5.0: 'five',
18                                 6.0: 'six',
19                                 7.0: 'seven',
20                                 8.0: 'eight',
21                                 9.0: 'nine',
22                                 10.0: 'ten'}
23            }
24block_params = {'block_type': 'type_8',
25                'f_params': N_params,
26                'width': 5.0,
27                'height': 10.0,
28                }
29main_params = {'filename': 'ex_axes_6.pdf',
30               'paper_height': 10.0,
31               'paper_width': 5.0,
32               'block_params': [block_params],
33               'transformations': [('scale paper',)]
34               }
35Nomographer(main_params)

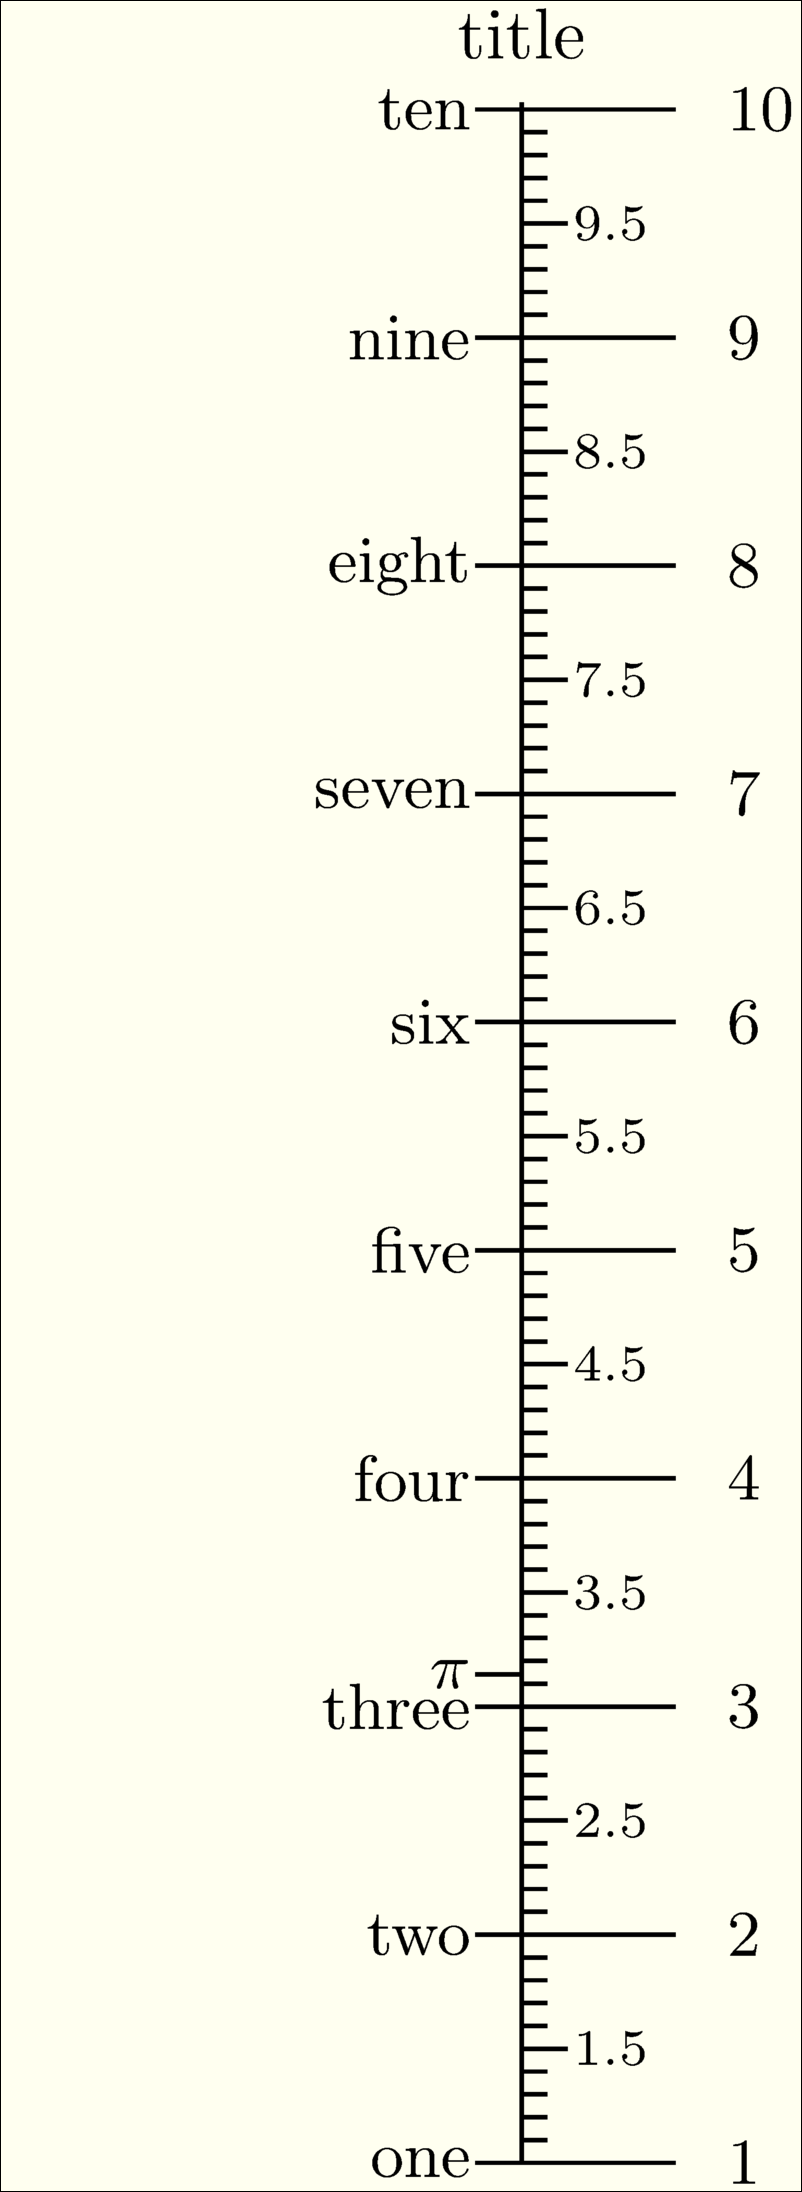
Combining manual lines and a linear scale.
 1# ex_axes_7.py
 2
 3N_params = {'u_min': 1.0,
 4            'u_max': 10.0,
 5            'function': lambda u: u,
 6            'title': 'title',
 7            'tick_levels': 2,
 8            'tick_text_levels': 1,
 9            'tick_side': 'left',
10            'scale_type': 'manual line',
11            'manual_axis_data': {1.0: 'one',
12                                 2.0: 'two',
13                                 3.0: 'three',
14                                 3.1415: r'$\pi$',
15                                 4.0: 'four',
16                                 5.0: 'five',
17                                 6.0: 'six',
18                                 7.0: 'seven',
19                                 8.0: 'eight',
20                                 9.0: 'nine',
21                                 10.0: 'ten'},
22            'extra_params': [{'u_min': 1.0,
23                              'u_max': 10.0,
24                              'scale_type': 'linear',
25                              'tick_levels': 3,
26                              'tick_text_levels': 2,
27                              'tick_side': 'right',
28                              }]
29            }
30block_params = {'block_type': 'type_8',
31                'f_params': N_params,
32                'width': 5.0,
33                'height': 10.0,
34                }
35main_params = {'filename': 'ex_axes_7.pdf',
36               'paper_height': 10.0,
37               'paper_width': 5.0,
38               'block_params': [block_params],
39               'transformations': [('scale paper',)]
40               }
41Nomographer(main_params)
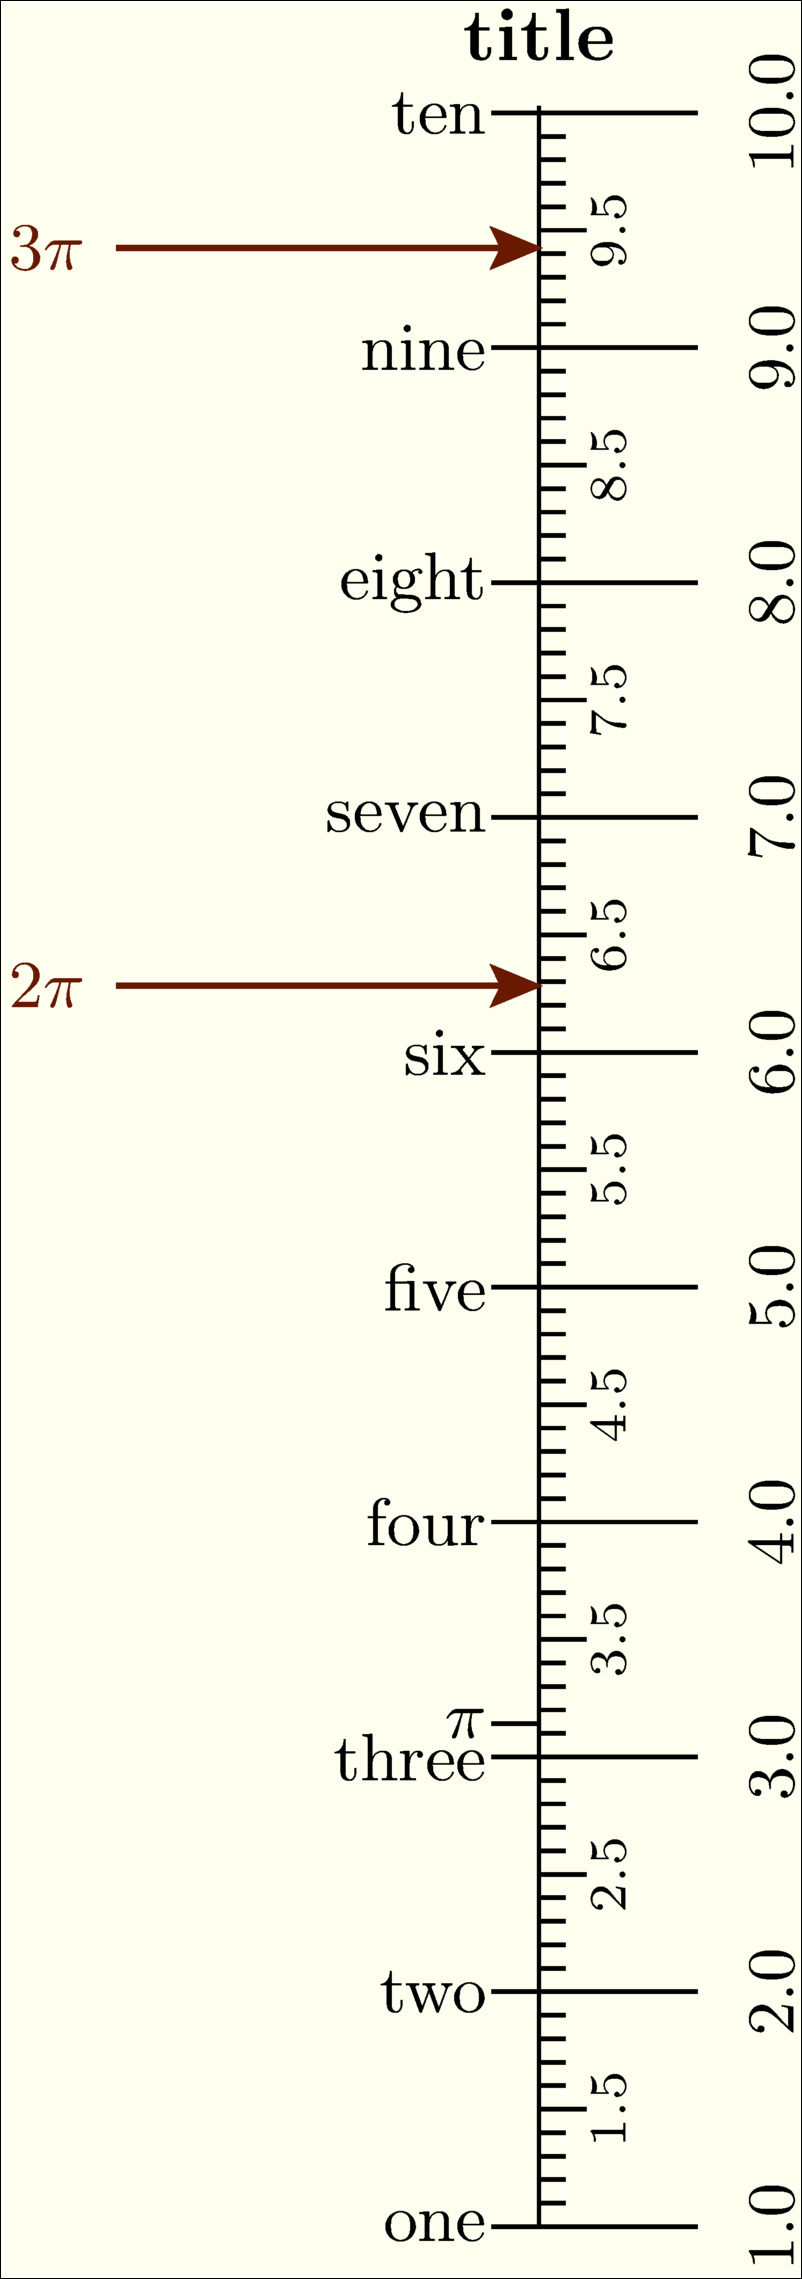
Manual arrows ('scale_type':'manual arrow')
Manual arrows can be used to point values in the scale using arrows.
 1# ex_axes_7_1.py
 2
 3N_params = {'u_min': 1.0,
 4            'u_max': 10.0,
 5            'function': lambda u: u,
 6            'title': r'\bf title',
 7            'tick_levels': 2,
 8            'tick_text_levels': 1,
 9            'tick_side': 'left',
10            'scale_type': 'manual line',
11            'manual_axis_data': {1.0: 'one',
12                                 2.0: 'two',
13                                 3.0: 'three',
14                                 3.1415: r'$\pi$',
15                                 4.0: 'four',
16                                 5.0: 'five',
17                                 6.0: 'six',
18                                 7.0: 'seven',
19                                 8.0: 'eight',
20                                 9.0: 'nine',
21                                 10.0: 'ten'},
22            'extra_params': [{'u_min': 1.0,
23                              'u_max': 10.0,
24                              'scale_type': 'linear',
25                              'tick_levels': 3,
26                              'tick_text_levels': 2,
27                              'tick_side': 'right',
28                              'extra_angle': 90.0,
29                              'text_horizontal_align_center': True,
30                              'text_format': r"$%2.1f$"},
31                             {'scale_type': 'manual arrow',           # <-
32                              'manual_axis_data': {6.2830: r'$2\pi$',
33                                                   9.4245: r'$3\pi$'},
34                              'arrow_color': color.cmyk.Sepia,
35                              'arrow_length': 2.0,
36                              'text_color': color.cmyk.Sepia,
37                              }]
38            }
39block_params = {'block_type': 'type_8',
40                'f_params': N_params,
41                'width': 5.0,
42                'height': 10.0,
43                }
44main_params = {'filename': 'ex_axes_7_1.pdf',
45               'paper_height': 10.0,
46               'paper_width': 5.0,
47               'block_params': [block_params],
48               'transformations': [('scale paper',)]
49               }
50Nomographer(main_params)
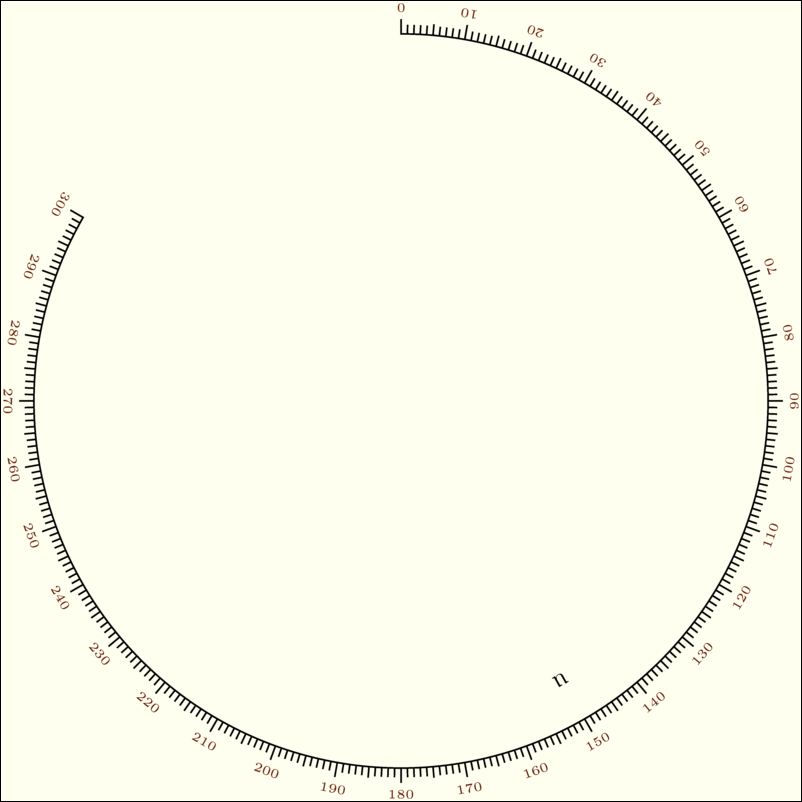
Manual function ('function_x' and 'function_y')
If one wants to explicitely draw scale in xy-scace, parameters 'function_x' and 'function_y' can be used
in conjuction with block type 8. In the following example circular scale is drawn.
 1# ex_axes_8.py
 2
 3N_params = {'u_min': 0.0,
 4            'u_max': 300.0,
 5            'function_x': lambda u: 3 * sin(u / 180.0 * pi),
 6            'function_y': lambda u: 3 * cos(u / 180.0 * pi),
 7            'title': 'u',
 8            'tick_levels': 3,
 9            'tick_text_levels': 1,
10            'title_x_shift': -0.5,
11            }
12block_params = {'block_type': 'type_8',
13                'f_params': N_params,
14                'width': 5.0,
15                'height': 15.0,
16                }
17main_params = {'filename': 'ex_axes_8.pdf',
18               'paper_height': 10.0,
19               'paper_width': 10.0,
20               'block_params': [block_params],
21               'transformations': [('scale paper',)]
22               }
23Nomographer(main_params)
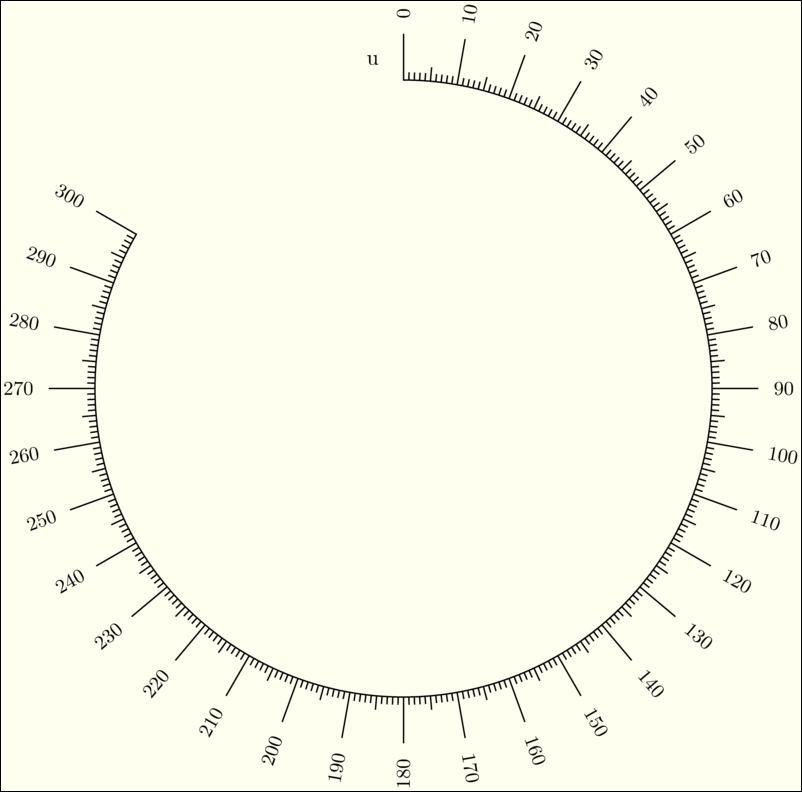
In the following we fine-tune the appearance of the scale. Tick lengths are explicitly given with params 'grid_length_x'
(note name with bad logic), text sizes are tuned with params 'text_size_x' and distance of text to the scale is set using
'text_distance_x'. 'full_angle' parameter allows text to be drawn also upside down and text angle is rotated with
'extra_angle'.
 1# ex_axes_8_1.py
 2
 3N_params = {'u_min': 0.0,
 4            'u_max': 300.0,
 5            'function_x': lambda u: 3 * sin(u / 180.0 * pi),
 6            'function_y': lambda u: 3 * cos(u / 180.0 * pi),
 7            'title': 'u',
 8            'tick_levels': 3,
 9            'tick_text_levels': 1,
10            'title_x_shift': -0.5,
11            'grid_length_0': 0.8/4,
12            'grid_length_1': 0.6/4,
13            'grid_length_2': 0.5/4,
14            'grid_length_3': 0.4/4,
15            'grid_length_4': 0.3/4,
16            'text_size_0': text.size.tiny,
17            'text_size_1': text.size.tiny,
18            'text_size_2': text.size.tiny,
19            'text_size_3': text.size.tiny,
20            'text_size_4': text.size.tiny,
21            'text_distance_0': 1.2/4,
22            'text_distance_1': 1.1/4,
23            'text_distance_2': 1.0/4,
24            'text_distance_3': 1.0/4,
25            'text_distance_4': 1.0/4,
26            'title_distance_center': 0.7,
27            'title_opposite_tick': True,
28            'title_draw_center': True,
29            'text_format': "$%3.1f$",
30            'full_angle': True,
31            'extra_angle': 90.0,
32            'text_horizontal_align_center': True,
33            'text_format': r"$%2.0f$",
34            'text_color': color.cmyk.Sepia,
35            }
36block_params = {'block_type': 'type_8',
37                'f_params': N_params,
38                'width': 5.0,
39                'height': 15.0,
40                }
41main_params = {'filename': 'ex_axes_8_1.pdf',
42               'paper_height': 10.0,
43               'paper_width': 10.0,
44               'block_params': [block_params],
45               'transformations': [('scale paper',)]
46               }
47Nomographer(main_params)
Linear scale ('scale_type':'log')
Often one needs to use logarithmic functions in scales and 'scale_type':'log' makes some optimizations for this kind
of scale appearance.
 1# ex_axes_9.py
 2
 3N_params = {'u_min': 1.0,
 4            'u_max': 10000.0,
 5            'function': lambda u: log(u),
 6            'title': 'u',
 7            'scale_type': 'log',
 8            }
 9block_params = {'block_type': 'type_8',
10                'f_params': N_params,
11                'width': 5.0,
12                'height': 15.0,
13                }
14main_params = {'filename': 'ex_axes_9.pdf',
15               'paper_height': 15.0,
16               'paper_width': 5.0,
17               'block_params': [block_params],
18               'transformations': [('scale paper',)]
19              }
20Nomographer(main_params)

Smart scales ('scale_type':'smart linear', 'scale_type':'smart log')
Linear and log scales just plot ticks and texts as given with params 'tick_levels' and 'tick_text_levels'. Often
this approach generates busy scales with overlapping texts and too dense ticks. Better approach is to use smart
linear scales 'scale_type':'smart linear' or smart log scales 'scale_type':'smart log' These scales check that
tick and text distances does not go below given thresholds ('tick_distance_smart' and 'text_distance_smart'.
TODO: example to use smart scales.
Common axis params
parameter |
default value |
explanation |
|---|---|---|
|
|
String. To identify the axis. |
|
|
String. To align blocks w.r.t each other along axes with same tag. |
|
|
String. To double-align blocks w.r.t each other along axes with same tag. |
|
|
String. Axis title. |
|
|
Float. Title shift in x-direction. |
|
|
Float. Title shift in y-direction. |
|
|
String. Scale type. Can be |
|
|
Integer. How many levels (minor, minor-minor, etc.) of ticks are drawn. Largest effect to ‘linear’ scale. |
|
|
Integer. How many levels (minor, minor-minor, etc.) of texts are drawn. Largest effect to ‘linear’ scale. |
|
|
String. Tick and text side in final paper. Can be: |
|
|
Boolean. If axis is treated as reference line that is a turning point. |
|
|
Float. Fraction of reference line over other lines. |
|
|
Dict. Manually set tick/point positions and text positions. Could be for example: |
|
|
Boolean. Title is drawn to center of line. |
|
|
Float. When |
|
|
Boolean. Title in opposite direction w.r.t ticks. |
|
|
func(u). function to align different scales. |
|
|
Float. If axis is aligned with other axis, this value x offsets final scale. |
|
|
Float. If axis is aligned with other axis, this value y offsets final scale. |
|
|
String. Format for numbers in scale. |
|
|
Array of Dicts. List of dictionary of params to be drawn additionally. |
|
|
Float. where #=0,1,2,3 or 4. Distance of text from scale line. Number corresponds to the level, where 0 is the major tick and 4 is the most minor ticks. |
|
|
Float. where #=0,1,2,3 or 4. Length of the tick. Number corresponds to the level, where 0 is the major tick and 4 is the most minor ticks. |
|
|
Where #=0,1,2,3 or 4. Text size for linear scale specified by parameter. For example: |
|
|
Where #=0,1 or 2. Text size for log scale specified by parameter. For example: |
|
|
Boolean. If true, text can be upside down, otherwise +- 90 degrees from horizontal. Good foor example for full circle scales. |
|
|
Float. Angle to rotate tick text from horizontal along tick. |
|
|
Boolean. Aligns tick text horizontally to center. Good when text rotated 90 degrees. |
|
|
Boolean. Side left or right is relative according to traveling of scale from min to max. |
|
|
Float. Used with arrow scale. |
|
|
Float. Used with arrow scale.. |
|
|
Color. Used with arrow scale. |
|
|
Color. Color of axis. |
|
|
Color. Color of tick texts. |
|
|
Array. List of extra title dicts for scale. Could be i.e.``[{‘dx’:1.0, ‘dy’:1.0, ‘text’:’extra title 1’, ‘width’:5, ‘pyx_extra_defs’: [color.rgb.red,text.size.Huge]}, {‘text’: ‘extra title 2’}]``. |
|
|
None/Float. Defines number with |
|
|
None/Float. Defines number with |
|
|
Float. Minimum distance between smart ticks. |
|
|
Float. Minimum distance between smart texts. |