Introduction
What is a Nomogram and Why Would It Interest Me?
A nomogram or nomograph is a diagram that provides an easy, graphical way of calculating the result of a mathematical formula. Sometimes also called an alignment chart, a nomogram consists of a set of numbered scales, usually one for each variable in the formula, arranged so that a straightedge can be placed across known values to find the unknown value that solves the formula. Since an equation in two variables is usually represented by a graph, most nomograms represent formulas that involve three or more variables.
These graphical calculators were invented in 1880 by Philbert Maurice d’Ocagne and used extensively for many years to provide engineers with fast graphical calculations of complicated formulas to a practical precision. Electronic calculators and computers have made nomograms much less common today, but when a fast, handy calculator of a particular formula is needed they can be very useful. The cost to produce one is a sheet of paper, and they are fun to design, easy to use, and can be beautiful designs that engage people.
For example, here’s a nomogram from 1920 that relates the variables \(l\), \(s\), \(r\) and \(\alpha\) for a slider-crank mechanism:
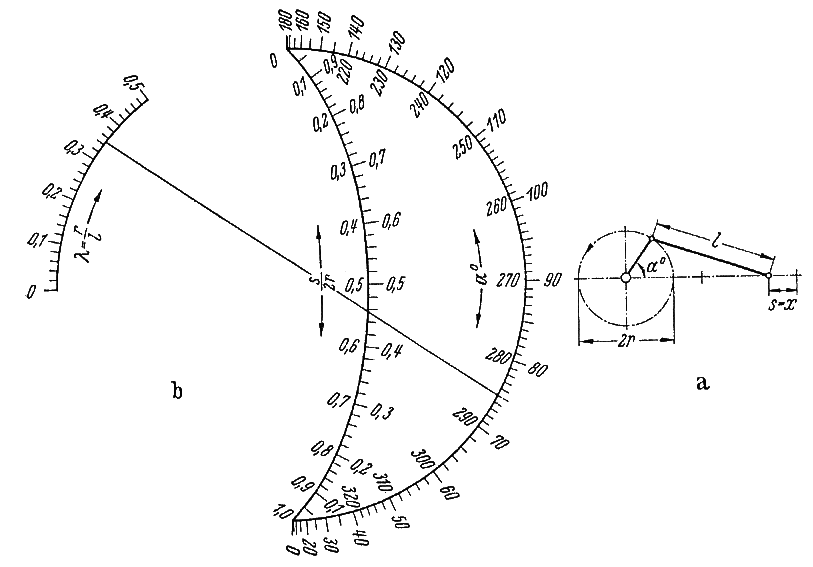
The equation that this solves is quite complicated:
\(s = r(1 - \cos \alpha) + l(1 - (1 - \lambda^2 \sin^2 \alpha)^{1/2})\) where \(\lambda = r/l\)
There is a sample isopleth line on the nomogram that solves the equation for one set of values, scaled by \(r\). For a value \(\lambda = r/l = 0.35\) and an angle \(\alpha = 75^{\circ}\), we find that \(s/2r \approx 0.455\), where we read off the same sides of the \(s/2r\) and \(\alpha\) scales. Note that in practice this nomogram would be drawn by a draftsman to a much larger scale for greater precision.
Try it out yourself! Pick a radius \(r\), a length \(l \geq 2r\) and an angle \(\alpha\), and find \(s\) on your calculator. Imagine an engineer solving this by hand for various parameters before calculators were invented. Then solve it on the nomogram here with a straightedge and compare your answers. When you’re finished, choose values of \(r\), \(l\) and \(s\) and solve for \(\alpha\). You’ll realize that a nomogram can solve even for implicit variables that cannot be isolated on one side of the equation!
How in the world was this nomogram designed? Somehow this layout of scales solves the equation for every combination of its values using just a straightedge. For the nine most common functional relationships, PyNomo generates vector-image nomograms in PDF form using simple but customizable scripts in which you provide the functions of the variables. Beyond this, experienced designers can use a tenth PyNomo option to draw nomograms with arbitrarily complicated layouts such as this one, and even linear and circular slide rules.
Designing nomograms is an enjoyable pursuit, much more so than in the past since PyNomo can provide the expert knowledge and also serve as the technical draftsman. And as described below, nomograms are very useful for a variety of applications even today.
Uses of Nomograms
Nomograms have been used in an extensive array of applications. A sample includes
The original application by d’Ocagne, the automation of complicated “cut and fill” calculations for earth removal during the construction of the French national railway system. This was an important proof of concept, because the calculations are non-trivial and the results translated into significant savings of time, effort, and money.
The design of channels, pipes and weirs for regulating the flow of water.
The work of Lawrence Henderson, in which nomograms were used to correlate many different aspects of blood physiology. It was the first major use of nomograms in the United States and also the first medical nomograms anywhere. Nomograms continue to be used extensively in medical fields.
Ballistics calculations prior to fire control systems, where calculating time was critical.
Machine shop calculations, to convert blueprint dimensions and perform calculations based on material dimensions and - properties. These nomograms often included markings for standard dimensions and for available manufactured parts.
Statistics, for complicated calculations of properties of distributions and for operations research including the design of acceptance tests for quality control.
Operations Research, to obtain results in a variety of optimization problems.
Chemistry and chemical engineering, to encapsulate both general physical relationships and empirical data for specific compounds.
Aeronautics, in which nomograms were used for decades in the cockpits of aircraft of all descriptions. As a navigation and flight control aid, nomograms were fast, compact and easy-to-use calculators.
Astronomical calculations, as in the post-launch orbital calculations of Sputnik 1 by P.E. Elyasberg.
Engineering work of all kinds: Electrical design of filters and transmission lines, mechanical calculations of stress and loading, optical calculations, and so forth.
Military, where complex calculations need to be made in the field quickly and with reliability not dependent on electrical devices.
Nomograms serve a dual purpose: they allow nitty-gritty fast computation—answers in the form of unambiguous numbers—and at the same time provide tremendous insight through the relationship of the various scales, their labeling, limits, and gradations. The better nomograms are self-documenting. They provide a visual model of a system and manifest a wonderful ability to imply interrelationships and cross-variable sensitivities. As the mathematician and computer scientist Richard Hamming remarked, “The purpose of computing is insight, not numbers.”
Parts of Nomograms
There are few parts to a nomogram, but it is important to know them as they will be referenced throughout the documentation. We will introduce the terms with most common type of nomogram consisting of three parallel straight scales. This form is used to solve an equation in which functions of three variables sum to zero. The simplest such formula is \(u_1 + u_2 + u_3 = 0\) for the three variables \(u_1\), \(u_2\) and \(u_3\). An example of this type of nomogram is shown below, annotated with terms used to describe the parts of a nomogram. In general the scales can be functions of \(u_1\), \(u_2\) and \(u_3\), but here the scales are simply the variables. The nomogram solves the equation for any variable given values of the other two variables, with the sample isopleth here representing the solution for values 7, 2 and -9.
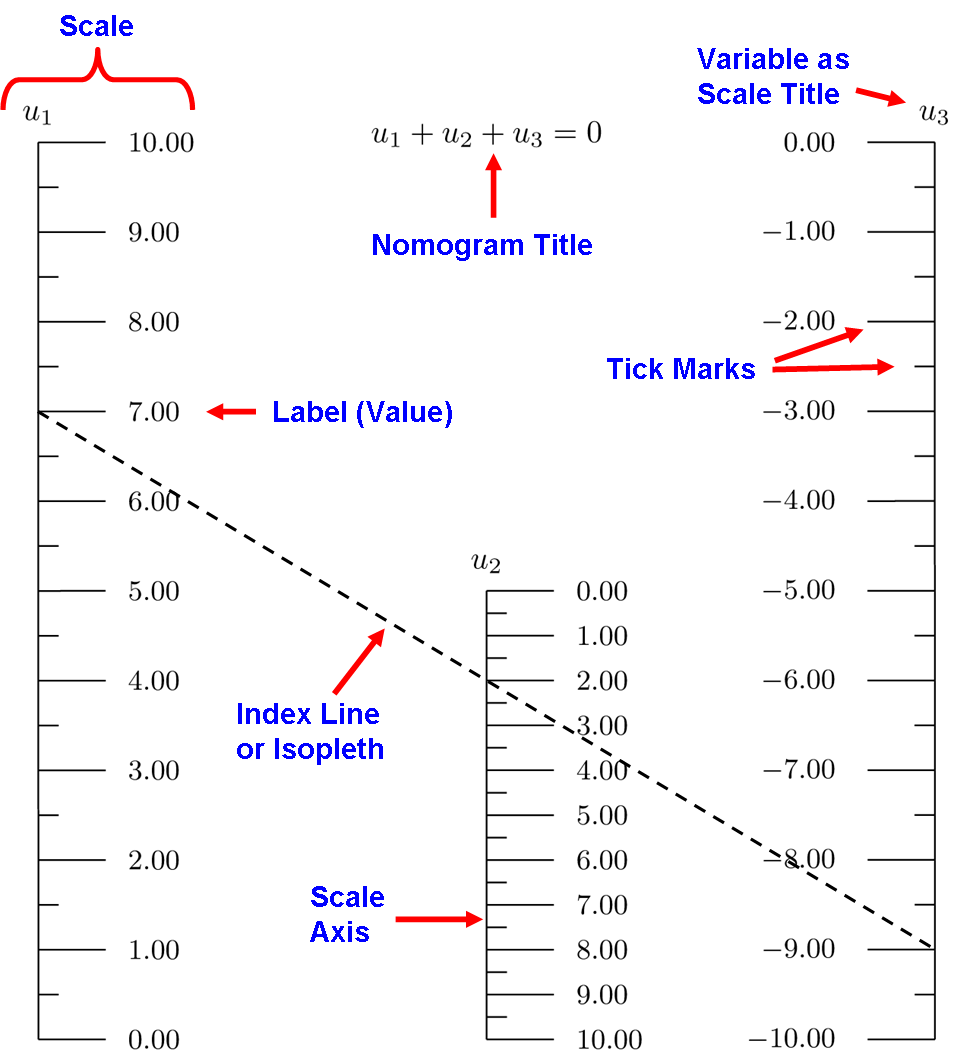
Nomograms should be self-contained, that is, anyone can understand what the nomogram solves and how to use it with only passing knowledge of what they are. This means that there should be a sample isopleth to guide the user. If the application is not obvious, it should be listed in the title, and perhaps a figure relating the variables to the application may be called for. The equation being solved should also be listed on the nomogram; we can assure you there are few more tedious tasks than reverse-engineering a decades-old nomogram back to its defining equation.
What Can PyNomo Do For Me?
PyNomo allows us to design nearly all nomograms, even grid and compound nomograms for equations of more than three variables, with very little mathematics background. A knowledge of algebra is necessary in order to first arrange the equation into one of the ten standard types of equation that PyNomo supports (nine specific types and one general type).
Then a PyNomo script is written for the nomogram type that fits the relationships among the variable functions. Perhaps two functions are multiplied and one divided in your equation, or perhaps the relationships are more complicated. Typically this involves looking through the table of formats for the types of equations PyNomo supports and choosing one that matches your equation. Then a sample script from a standard example of that type is copied and edited to use the functions in your equation. Copying and modifying a standard example as a starting point is easy and fast–we all do that.
The script is run and a PDF file is automatically created with the nomogram laid out for printing. Once you start making nomograms you may want to customize how they look—the spacing of tick marks on the scales, the scale titles, the location of the nomogram title, and so forth. You may want to draw a sample isopleth and add color to the scales and their labels. PyNomo offers many such features, and this documentation tries to cover them all, but don’t be put off by these extra details sprinkled throughout the examples here. They may make the scripts appear more complicated, but they are totally optional and can be ignored until the day you decide you really would like that one scale to be red. That’s the point where you look in the documentation for scale parameters that involve color.
Explore the tutorials and you will find yourself amazed that you are creating nomograms that really do work. There are also sections of this documentation that deal with more advanced topics such as designing nomograms for very complicated equations using determinant equations, applying transformations and projections to twist and stretch nomograms to square them up for more precise use, and even using PyNomo to create linear and circular slide rules.